RSS

Category Archives: African genetics

SW African Bantu matrilineages

Prolific researcher Chiara Barbieri has put online another interesting study on African genetics, this time about the Bantu populations of Southwestern and Central-Southern Africa (i.e. Namibia, Angola, Botswana and Zambia).
Chiara Barbieri et al., Migration and interaction in a contact zone: mtDNA variation among Bantu-speakers in southern Africa. bioRXiv 2014. Freely accessible (pre-pub) → LINK

ABSTRACT

Bantu speech communities expanded over large parts of sub-Saharan Africa within the last 4000-5000 years, reaching different parts of southern Africa 1200-2000 years ago. The Bantu languages subdivide in several major branches, with languages belonging to the Eastern and Western Bantu branches spreading over large parts of Central, Eastern, and Southern Africa. There is still debate whether this linguistic divide is correlated with a genetic distinction between Eastern and Western Bantu speakers. During their expansion, Bantu speakers would have come into contact with diverse local populations, such as the Khoisan hunter-gatherers and pastoralists of southern Africa, with whom they may have intermarried. In this study, we analyze complete mtDNA genome sequences from over 900 Bantu-speaking individuals from Angola, Zambia, Namibia and Botswana to investigate the demographic processes at play during the last stages of the Bantu expansion. Our results show that most of these Bantu-speaking populations are genetically very homogenous, with no genetic division between speakers of Eastern and Western Bantu languages. Most of the mtDNA diversity in our dataset is due to different degrees of admixture with autochthonous populations. Only the pastoralist Himba and Herero stand out due to high frequencies of particular L3f and L3d lineages; the latter are also found in the neighboring Damara, who speak a Khoisan language and were foragers and small-stock herders. In contrast, the close cultural and linguistic relatives of the Herero and Himba, the Kuvale, are genetically similar to other Bantu-speakers. Nevertheless, as demonstrated by resampling tests, the genetic divergence of Herero, Himba, and Kuvale is compatible with a common shared ancestry with high levels of drift and differential female admixture with local pre-Bantu populations.

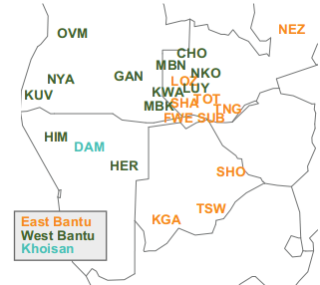
Figure 1: Map showing the rough geographical location of populations, 
colored by linguistic affiliation. Abbreviations of population labels are 
as specified in Table 1.

In spite of the Bantu-centric approach of the study, which also has its merits, my greatest interest is rather in the less typically Bantu lineages, which speak of admixture with several pre-Bantu populations.
In this sense I find the following highlights:

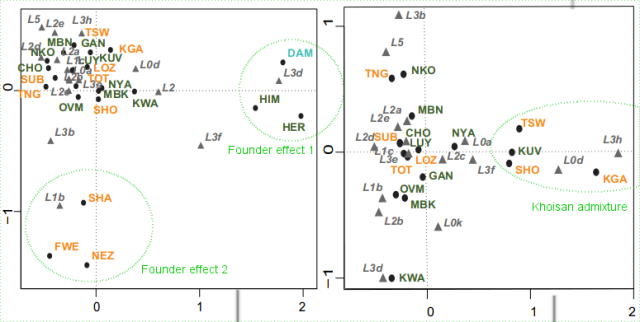
Fig. S2 (annotated in green by Maju): CA plots based on haplogroup frequencies. Left: all the dataset, right: excluding outliers.

L3d and L3f founder effect:
The Himba and Herero, as well as the non-Bantu pastoralists Damara make one distinctive cluster defined by the high frequencies of haplogroup L3d, as well as L3f (not present among the Damara but found among the Kuvale). As discussed in the paper, the Himba and Herero may be related to the Kuvale of SW Angola but they have notable differential levels (or directionality) of aboriginal admixture. 
As both L3d and L3f are present in West and East Africa alike, it is interesting to track the specific subhaplogroups implicated in this founder effect, something done in fig. 4. 
The main L3d sublineage is L3d3a1, whose haplotype network shows a largely Khoisan centrality (not Damara) although this node is shared also by some unspecified “other Bantu”. The Southern Africa specificity of L3d3a was already noticed in the past (see here). So it is very possible that we are before an aboriginal Southern African lineage, maybe arrived with the first Khoisan Neolithic (or whatever other ancient flow) rather than a Bantu-specific founder effect. 
The main L3f subhaplogroup is L3f1b4a, which seems more specifically Bantu, with a major branch concentrated among the Himba, Herero and Kuvale. This lineage is not found among the Damara in spite of the other strong affinity of this Khoisan population towards the Himba and Herero. L3f1b is found in Southern Africa, Kenya and Oman (per Bihar 2008), so we are probably before a distinctive East African element, not too likely to be genuinely Bantu but possibly just assimilated into Bantu ethnic identity. 
Even if both lineages converge in the Himba and Herero, they are almost certainly different inputs, one of Damara (herder Khoisan) origin and the other of Bantuized East African origin maybe.
L1b founder effect:
L1b is essentially a West African lineage concentrated in the Sahel area from Chad westwards (although L1b1a2 is from the Nile basin). A particularly high frequency population are the Fulani pastoralists, original from the Westernmost African plateaus, who ruled many kingdoms in West Africa between the collapse of the colonial rule by Morocco and the consolidation of the European conquest of the continent.
As this study does not dwell in sublineages, we cannot understand the most likely specific origins of it among several Southern African populations, specifically the pooled NE Zambians (13%) and the Fwe and Shanjo of SW Zambia (24-27%).
In any case it is a notorious founder effect, almost absent in other Bantus of the area (0-10%).
Typical L0d Khoisan admixture:
This element is concentrated in Botswana (~25%) and with highest frequencies in the SW Kgalagadi (53%). It is also important among the Kuvale of SW Angola (21%). Other Bantu populations in this dataset have frequencies under 10%, some even zero. The Damara have 13%.
We know from previous studies that it is also found at high frequencies among the Xosha of South Africa (L0d3).
While L3h appears marked in the graph, the lineage is in fact absent in all populations except at very low frequency among the Kuvale (2%), so it does not seem actually of any relevance. 
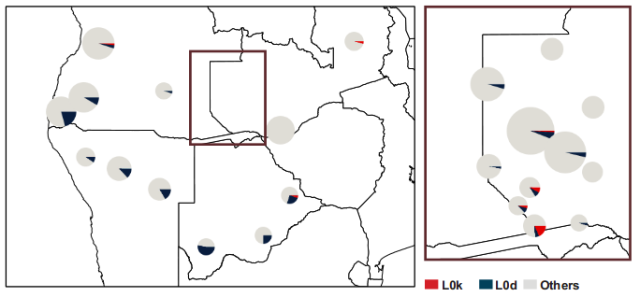
Less typical L0k around SW Zambia:
While L0k is generally considered an aboriginal Southern African lineage it has a much more northernly distribution than the more common and surely older L0d. Its area of greatest commonality seems to be SW Zambia (see here and here).
This study confirms this distribution:

Supplementary Figure S3[A]: Haplogroup frequencies of important haplogroups in the populations studied here. A: Haplogroups L0d and L0k.(…)

The size of the circles is proportional to the sample size.

High frequencies of L1c (Pygmy admixture marker) among Southern African Bantus:
An interesting element is the commonality of L1c, typical of Western Pygmies and some other populations from Gabon (possibly representative of the wider West-Central Africa jungle region, not too well studied otherwise), among almost all Bantu populations in this dataset. 
The exceptions are the Herero, Himba, Kgalagadi and Tswana (0%), as well as the NE Zambians (4%). All the rest have frequencies between 12% and 30%. Even the non-Bantu Damaras have 11% of it.
In my understanding this almost certainly implies a notable level of admixture with Western Pygmies of the Bantus from especially Angola and West Zambia. A phenomenon that may be widespread in Central-West Africa. 
It is notable however that at least many of the populations with the highest likely Khoisan admixture (in its various forms, discussed in the previous sections) have the lesser frequencies of L1c (Pygmy admixture). So to a great extent these two aboriginal influences in Bantu mtDNA seem mutually exclusive and were probably produced after settlement rather than “on the march”. 
This in turn arises some interesting questions about the ethnic geography of Africa before the Bantu expansion. 

Update: I just noticed that Ethiohelix has parsed the haplogroups’ frequency into a very helpful chartLINK.

See also:
 

East African mtDNA charts at Ehio Helix

There’s a (thankfully) growing interest in African genetics, both because of its importance for the origin of Humankind as a whole and also for its more direct relevance for Africans and people of recent African descent elsewhere. Therefore I can’t but emphasize again the great work that Ethio Helix blog is doing in this aspect.
Today Ethio Helix gifts us with a most informative visual synthesis of East African mtDNA in form of bar charts. These are extremely interesting because of the wild array of lineages that this African region has, including quite significant amounts of less frequent lineages like L4, L5 or L6, or also the more extended but still worth studying L0 (and of course L2 and L3, as well as the occasional L1).
So I strongly recommend you to take a look. If you have any problems with the graphs (Google seems a bit buggy on them, he says), I solved them by mere zooming out (some sort of white layer was obscuring the rightmost part of them).

Update: it does not work well with Chrome (slow on Windows, does not work at all on Ubuntu) but it works perfect with Firefox.

A complementary Y-DNA chart is linked at this older post.
 
5 Comments

Posted by on December 9, 2013 in African genetics, mtDNA, population genetics


Reconstructing human demographic history from IBS segments

Figure 1. An eight base-pair tract of identity by state (IBS).
Identity-by-state (IBS) segments are those located between any two SNPs (polymorphisms, letters that vary among individuals). According to this new paper, they seem to be evolutionarily neutral and therefore their length, modified by recombination events each new generation, is a good trail to reconstruct human demographic history.
Kelley Harris & Rasmus Nielsen, Inferring Demographic History from a Spectrum of Shared Haplotype Lengths. PLoS Genetics 2013. Open accessLINK [doi:10.1371/journal.pgen.1003521]

Abstract

There has been much recent excitement about the use of genetics to elucidate ancestral history and demography. Whole genome data from humans and other species are revealing complex stories of divergence and admixture that were left undiscovered by previous smaller data sets. A central challenge is to estimate the timing of past admixture and divergence events, for example the time at which Neanderthals exchanged genetic material with humans and the time at which modern humans left Africa. Here, we present a method for using sequence data to jointly estimate the timing and magnitude of past admixture events, along with population divergence times and changes in effective population size. We infer demography from a collection of pairwise sequence alignments by summarizing their length distribution of tracts of identity by state (IBS) and maximizing an analytic composite likelihood derived from a Markovian coalescent approximation. Recent gene flow between populations leaves behind long tracts of identity by descent (IBD), and these tracts give our method power by influencing the distribution of shared IBS tracts. In simulated data, we accurately infer the timing and strength of admixture events, population size changes, and divergence times over a variety of ancient and recent time scales. Using the same technique, we analyze deeply sequenced trio parents from the 1000 Genomes project. The data show evidence of extensive gene flow between Africa and Europe after the time of divergence as well as substructure and gene flow among ancestral hominids. In particular, we infer that recent African-European gene flow and ancient ghost admixture into Europe are both necessary to explain the spectrum of IBS sharing in the trios, rejecting simpler models that contain less population structure.

The most interesting graph, synthesizing the result for standard HapMap European and African proxy samples is figure 7. However I have major issues with the age estimates, which seem to be half what is needed to be realistic according to archaeological and other genetic data (unlineal haplogroup history, for example). Therefore I have annotated it with a revised timeline, so it fits better with the objective data:


Figure 7. A history inferred from IBS sharing in Europeans and Yorubans.
This is the simplest history we found to satisfactorily explain IBS tract sharing in the 1000 Genomes trio data. It includes ancient ancestral population size changes, an out-of-African bottleneck in Europeans, ghost admixture into Europe from an ancestral hominid, and a long period of gene flow between the diverging populations.
(Right margin annotations by Maju).

Indeed the simplest revision of the time-scale was to double it. I guess it can be refined a bit more than that, maybe pushing it a bit further into the past, but the alternative time-scale I propose fits closely enough with known archaeological data like the time of the OoA to Arabia and Palestine or the spread of Acheulean (and therefore H. ergaster, common ancestor of Neanderthals and H. sapiens) out of Africa c. 1 Ma ago to illustrate that the reconstruction seems pretty much correct overall but fails when estimating the dates (because of scholastic-autistic academic biases that are too common in the field of human population genetics).

Update: even Dienekes agrees, on his own well documented reasoning, with a x2 mutation rate being necessary for the above graph.


New sublineages in Y-DNA haplogroups A3 and B2a

Improving the knowledge of African genetics.
Rosaria Scozzari et al., Molecular Dissection of the Basal Clades in the Human Y Chromosome Phylogenetic Tree. PLoS ONE 2013. Open accessLINK [doi:10.1371/journal.pone.0049170]
Abstract

One hundred and forty-six previously detected mutations were more precisely positioned in the human Y chromosome phylogeny by the analysis of 51 representative Y chromosome haplogroups and the use of 59 mutations from literature. Twenty-two new mutations were also described and incorporated in the revised phylogeny. This analysis made it possible to identify new haplogroups and to resolve a deep trifurcation within haplogroup B2. Our data provide a highly resolved branching in the African-specific portion of the Y tree and support the hypothesis of an origin in the north-western quadrant of the African continent for the human MSY diversity.

Figure 1. Revised topology of the deepest portion of the human MSY tree.
The names of the mutations genotyped are indicated on the branches (green, mutations from the paper by Karafet et al. [14]; black, mutations from the paper by Cruciani et al. [16];
red, previously undescribed mutations, see text). For the sake of
clarity, the internal structure of haplogroups B-M108.1 (2 branches) and
B-50f2(P) (8 branches) is not shown (black triangles). The phylogenetic
position of mutations mapping within haplogroup CT is shown in Figure S1.
Dashed lines indicate putative branchings (no positive control
available). The microsatellite intermediate allele DYS449.2, that was
found to delineate new phylogenetic structure in human Y chromosome
haplogroup tree [42], was not observed in 19 Y*(xBT) and 4 B chromosomes analyzed.

Notice that the nomenclature per ISOGG is right now as follows:

  • A1b-V148 is now known as A0
  • A1a-V4 retains the name A1a
  • A2-V50 is A1b1a
  • A3-M32 is A1b1b
    • A3a-M28 is A1b1b1
    • A3b-M144 is A1b1b2

See ISOGG for more details.

 
Leave a comment

Posted by on May 17, 2013 in Africa, African genetics, Y-DNA


Synthesis of the Spanish-language series on the expansion of H. sapiens (2)

One of the reasons I have been a bit too saturated and maybe not writing as much as usual is that I am collaborating in a series in Spanish language for the blog Noticias de Prehistoria – Prehistoria al Día.
I already mentioned last month the initial article[es] of the series by David Sánchez, which dealt with the African Middle Paleolithic (MSA, Lupembian, Aterian, etc.) We have not been idle in the meantime but actually wrote a number of other articles that may well be of your interest:
There is still a lot to do for the series to be complete but the time for a synthetic review in this blog is quite overdue. I will skip the brief intro to population genetics on the belief that most readers here have a decent idea, but the other three articles ask for due mention.

Expansion of H. sapiens in Africa (genetic viewpoint)

This is something that complements David’s analysis of the African MP and that to a great extent I dealt with already at my former blog Leherensuge. I like graphs and maps because they often tell more than just words:

Basic mtDNA tree of Humankind
Branch length is proportional to coding region mutations from root per PhyloTree v.15 (L0k excepted)

We can see in this graph two main “moments” of diversification or expansion:
  1. The L0 and L2-6 nodes, followed soon by the L1 and L0a’b’f’k nodes
  2. The L0a’b’f, L0d and L2’3’4’6 nodes
The latter may well be calibrated with the archaeological evidence for the arrival of H. sapiens (MSA) to Southern Africa (L0d), which may be as old as 165 Ka but shows a clear increase in density since c. 130 Ka. I’d rather lean for the later date, that is roughly coincidental with the beginning of the Abbassia Pluvial, which must have provided good opportunities for expansion also in more northernly latitudes (the other nodes).
The first expansion is harder to estimate but c. 160 Ka. is a time in which we can see some of the first signs of expansion of our species within Africa (Jebel Irhoud and the already mentioned first Southern African MSA) so it is a tentative date. 
The geography of both expansions should be as follows (based on the raw data of Behar 2008):

Approx. geography of the first expansion of H. sapiens
(Purple dotted area indicates the max. likelihood for ‘mtDNA Eve’ location)
Approx. geography of the second expansion of H. sapiens

I also mentioned the expansion of L3, which preludes the migration Out of Africa, but this was already discussed in this entry.

Arrival to Arabia and Palestine

While most of the entries I am doing for this series deal with the genetic aspects, in this case I worked mostly with the archaeology, recycling many materials that are readily available in this blog and achieving the following synthetic map (recycling one by Armitage 2011) as central element of the article:

In addition to reviewing the archaeological discoveries of the last few years (and few older ones) I also discussed the issue of Neanderthal admixture, which most likely happened in this phase, and the possibility of some L(xM,N) lineages found in Arabia being from this period (see here).

Synthesis of Asian Prehistory

The last article so far in the series, authored by David Sánchez, has been published just today and is a very good visual review of the complex archaeological record of most of Asia in the period that interests us (most Middle Paleolithic with marginal mention of the earliest UP of West Asia, Siberia and neighboring areas, which will be reviewed more in depth in later articles). Probably the maps say it all, although we must understand that they only consider the best known sites:

Prior to Toba event (120-74 Ka BP)
(open circles: human remains, dots: other archaeological sites)
(notice that the date of Narmada hominin is most unclear, what is not reflected in the map)
Blue: 74-45 Ka BP
(stars: Neanderthal sites, open circles: other human remains, dots: archaeological sites, black: previous map)
Red: 45-35 Ka BP
(stars: neanderthal sites, open circles: other human remains, dots: archaeological sites, black & blue: previous maps)
Green: later expansion of H. sapiens in Northern Asia
(stars: Neanderthals, open circles: other human remains, dots: other archaeological sites, black, blue & red: previous maps)

I must say that the design of the maps is not quite the way I would have done myself but is still interesting. Very especially I miss lots of info on post-Toba South Asia. Also the Altai transition is not really well explained in my understanding. On the other hand East Asia is full of details and the overall picture of the archaeology of the Eurasian expansion is well described nonetheless.

PS- from the commentaries by David at his blog, it seems clear that he gives for granted the occupation of South Asia after Toba and therefore he did not consider it important to mark any more recent sites in the subcontinent. 


    Eye and skin pigmentation genetics: Cape Verdeans as informative population

    Cape Verde from space
    Still getting updated with the backlog. Here there is an interesting study on human pigmentation using the heavily admixed Cape Verdean (essentially West African + West Iberian) population as reference.
    Sandra Beleza et al., Genetic Architecture of Skin and Eye Color in an African-European Admixed Population. PLoS Genetics 2013. Open accessLINK [doi:10.1371/journal.pgen.1003372]

    Abstract

    Variation in human skin and eye color is substantial and especially apparent in admixed populations, yet the underlying genetic architecture is poorly understood because most genome-wide studies are based on individuals of European ancestry. We study pigmentary variation in 699 individuals from Cape Verde, where extensive West African/European admixture has given rise to a broad range in trait values and genomic ancestry proportions. We develop and apply a new approach for measuring eye color, and identify two major loci (HERC2[OCA2] P = 2.3×10−62, SLC24A5 P = 9.6×10⁻⁹) that account for both blue versus brown eye color and varying intensities of brown eye color. We identify four major loci (SLC24A5 P = 5.4×10⁻²⁷, TYR P = 1.1×10⁻⁹, APBA2[OCA2] P = 1.5×10⁻⁸, SLC45A2 P = 6×10⁻⁹) for skin color that together account for 35% of the total variance, but the genetic component with the largest effect (~44%) is average genomic ancestry. Our results suggest that adjacent cis-acting regulatory loci for OCA2 explain the relationship between skin and eye color, and point to an underlying genetic architecture in which several genes of moderate effect act together with many genes of small effect to explain ~70% of the estimated heritability.

    Children of Praia
    (CC by Otimarte)
    Most interestingly maybe the authors conclude that KITLG, a gene which displays large differences in allele frequency between Africa and Eurasia and has been therefore suggested to be a cause of pigmentation differences, does not actually play any obvious role in this matter.
    HERC2 (OCA2) is confirmed to be very important in eye color (semi-recessive inheritance for blue color), the only other gene known to affect eye color is SLC24A5, which is mostly involved in skin pigmentation however.  
    SLC24A5 and SLC45A2 are confirmed as important pigmentation genes. However two otherwise unsuspecting genes, APBA2 (near OCA2) and GRM5TYR, are found to have also important impact in skin pigmentation.
    Still most (~3/5) of the inherited pigmentation traits remain unexplained and are probably caused by some sort of complex interactions. Eye and skin pigmentation have no strong genetic correlation apparently.
    Some interesting images from the paper:

    Figure 1. Relationship of geography and ancestry to skin and eye color.
    Individual ancestry proportions for Cape Verdeans displayed on all four panels were obtained from a supervised analysis in frappe
    with K = 2 and HapMap’s CEU and YRI fixed as European and African
    parental populations. (a) Bar plots of individual ancestry proportions
    for Cape Verdeans across the islands. The width of the plots is
    proportional to sample size (Santiago, n = 172; Fogo, n = 129; NW
    cluster, n = 192; Boa Vista, n = 27). The proportion of African vs.
    European ancestry of the individuals is indicated by the proportion of
    blue vs. red color in each plot. (b) Individual African ancestry
    distribution in the total cohort of 685 Cape Verdeans (histogram) and in
    802 African Americans (kernel density curve) from the Family Blood
    Pressure Program (FBPP) [21].
    (c) Scatter-plot of skin color vs. Individual African ancestry
    proportions. Skin color is measured by the MM index described in
    Material and Methods. (d) Scatter-plot of eye color vs. Individual
    African ancestry proportions. Eye color is measured by the T-index,
    described in Figure 2 and Material and Methods. Points in scatter-plots are color coded according to the island of origin of the individuals.
    Figure 3. GWAS results for skin and eye color in the total Cape Verdean cohort.
    Results are shown as −log10(P
    value) for the genotyped SNPs. Plots are ordered by chromosomal
    position. (a,c) Genotype and admixture association scan results for skin
    color. (b,d) Genotype and admixture association scan results for eye
    color. (a,b) show the P values obtained in the initial scans and (c,d) the P values of the following scans adjusting for the strongest associated SNP (in SLC24A5 for skin color and in HERC2 for eye color). Dashed red lines correspond to the genome-wide significance threshold (P<5×10⁻⁸ in the genotype scan; P<7×10⁻⁶
    in the ancestry scan [see Material and Methods]). The location and
    identity of candidate genes are colored to correspond with chromosomal
    location; individual SNPs are given in Table 1.
    Figure 7. Genetic architecture of skin color variation.
    (a)
    Effect sizes of the loci associated with skin color. Effect values
    represent the beta values obtained from a regression model containing
    the four associated loci plus ancestry. (b) The pie chart represents the
    proportion of phenotypic variation accounted for by the different
    components, including non-heritable factors (~20%), the four major loci
    (~35%, color-coded as in [a]), and average genomic ancestry (44%). The
    heritable contributions were estimated by regression and variance
    decomposition as described in Material and Methods, and are also
    represented below the pie chart separately as grey (genomic ancestry) or
    open (four major loci) areas. However, because of admixture
    stratification, the heritable contributions overlap as described in the
    text.


    Khoesan and Coloured autosomal DNA in context

    There has been a number of studies coming out recently on Khoesan genetics but this one does not seem to be just redundant, providing some extra information instead.

    Desiree C. Petersen et al., Complex Patterns of Genomic Admixture within Southern Africa. PLoS Genetics 2013. Open accessLINK [doi:10.1371/journal.pgen.1003309]


    Abstract


    Within-population genetic diversity is greatest within Africa, while between-population genetic diversity is directly proportional to geographic distance. The most divergent contemporary human populations include the click-speaking forager peoples of southern Africa, broadly defined as Khoesan. Both intra- (Bantu expansion) and inter-continental migration (European-driven colonization) have resulted in complex patterns of admixture between ancient geographically isolated Khoesan and more recently diverged populations. Using gender-specific analysis and almost 1 million autosomal markers, we determine the significance of estimated ancestral contributions that have shaped five contemporary southern African populations in a cohort of 103 individuals. Limited by lack of available data for homogenous Khoesan representation, we identify the Ju/’hoan (n = 19) as a distinct early diverging human lineage with little to no significant non-Khoesan contribution. In contrast to the Ju/’hoan, we identify ancient signatures of Khoesan and Bantu unions resulting in significant Khoesan- and Bantu-derived contributions to the Southern Bantu amaXhosa (n = 15) and Khoesan !Xun (n = 14), respectively. Our data further suggests that contemporary !Xun represent distinct Khoesan prehistories. Khoesan assimilation with European settlement at the most southern tip of Africa resulted in significant ancestral Khoesan contributions to the Coloured (n = 25) and Baster (n = 30) populations. The latter populations were further impacted by 170 years of East Indian slave trade and intra-continental migrations resulting in a complex pattern of genetic variation (admixture). The populations of southern Africa provide a unique opportunity to investigate the genomic variability from some of the oldest human lineages to the implications of complex admixture patterns including ancient and recently diverged human lineages.

    The array of Khoesan populations senso stricto analyzed in this study is much smaller than that of Schebusch 2010 but this study has the advantage of including Cape Coloureds and their Baster relatives, partially descendants from the otherwise extinct pastoralist Khoekhoe (Hottentots, now considered a derogative term) who lived in much of Southern Africa upon the arrival of Bantu and Europeans, as well as the amaXhosa, a Bantu people which clearly display marked Khoesan admixture.

    Figure 1. Map of southern Africa
    showing distribution of sampling per population identifier and
    significant historical events that likely shaped ancestral
    contributions.

    There is brief mention of maternal and paternal DNA. Just to mention that mtDNA being mostly aboriginal (L0d/L0k) among the Khoesan (86-100%), the Coloureds (68%) and even the Xhosa (47%, all L0d), while aboriginal Y-DNA (essentially A2b and A2c2, plus occasional B2) is concentrated among the Ju/’hoan, with the !Xun being instead dominated by E1b1-M275, of putative East African (Nilotic?) origins. This is consistent with the !Xun being historically pastoralists. European patrilineages, notably R1b, are dominant among the Baster (92%) and Cape Coloured (71%).
    Coloureds only make up some 9% of South African population but they dominate the countryside in much of the former Cape Province. Namibian Basters are a subset of them who migrated northwards in 1868.

    Figure 2.  PCA and STRUCTURE analysis (click to expand)
    We can see in the graphics above how the North Cape Coloured and Baster only display minor Bantu admixture, being essentially a variable mix of European and Khoesan ancestry, with probably also some Malay input (apparent in the increase of the blue component relative to the European reference). Instead East Cape and Cape Town (D6) Coloured appear to have greater apportion of Bantu ancestry and, especially the later, a notable increase of the East Asian input.
    The STRUCTURE graph, particularly at K=9, is also informative about other African populations but I won’t dwell in that here. 
    The authors also made an interesting exercise of analysis using Ancestry Informative Markers with the !Xun and Xhosa:

    Figure 4. Ju/’hoan-Yoruba ancestry
    informative markers (AIMs) defined ancestral contributions to the !Xun
    and amaXhosa, providing evidence for two distinct !Xun lineages with
    differing ancestral contributions.
    It seems evident that much of the !Xun ancestry (up to 70%) does not fall in either (Ju/’hoan-Yoruba) category but it is something else, probably specific to this people. The Xhosa Khoesan ancestry also seems closer to the pastoralist !Xun than to the (likely more genuinely ancient) Ju/’hoan. 

    There is some more info in the paper but I feel that the essentials are sufficiently covered here. 

    See also:
     

    Cameroonian Y-DNA lineage A00 is older than Homo sapiens

    The news has been floating around in the anthropology and human population genetic circles for some time but it was not formally confirmed until now: a very ancient Y-DNA lineage appears to be so old that it can hardly be considered to be strictly Homo sapiens at its ultimate origin. The lineage is extremely rare however and has only been found so far in two men: an African-American (from the USA?) and eight Mbo individuals from Western Cameroon.

    Fernando L. Méndez et al., An African American Paternal Lineage Adds an Extremely Ancient Root to the Human Y Chromosome Phylogenetic Tree. AJHG 2013. Pay per view (free 6 months after publication) → LINK [doi:10.1016/j.ajhg.2013.02.002]

    Abstract

    We report the discovery of an African American Y chromosome that carries the ancestral state of all SNPs that defined the basal portion of the Y chromosome phylogenetic tree. We sequenced ∼240 kb of this chromosome to identify private, derived mutations on this lineage, which we named A00. We then estimated the time to the most recent common ancestor (TMRCA) for the Y tree as 338 thousand years ago (kya) (95% confidence interval = 237–581 kya). Remarkably, this exceeds current estimates of the mtDNA TMRCA, as well as those of the age of the oldest anatomically modern human fossils. The extremely ancient age combined with the rarity of the A00 lineage, which we also find at very low frequency in central Africa, point to the importance of considering more complex models for the origin of Y chromosome diversity. These models include ancient population structure and the possibility of archaic introgression of Y chromosomes into anatomically modern humans. The A00 lineage was discovered in a large database of consumer samples of African Americans and has not been identified in traditional hunter-gatherer populations from sub-Saharan Africa. This underscores how the stochastic nature of the genealogical process can affect inference from a single locus and warrants caution during the interpretation of the geographic location of divergent branches of the Y chromosome phylogenetic tree for the elucidation of human origins.

    Figure 1. Genealogy of A00, A0, and the Reference Sequence
    Lineages on which mutations were identified and lineages that
    were used for placing those mutations on the genealogy are
    indicated with thick and thin lines, respectively. The numbers of
    identified mutations on a branch are indicated in italics (four
    mutations in A00 were not genotyped but are indicated as shared
    by Mbo in this tree). The time estimates (and confidence intervals)
    are indicated kya for three nodes: the most recent common
    ancestor, the common ancestor between A0 and the reference
    (ref), and the common ancestor of A00 chromosomes from an
    African American individual and the Mbo. Two sets of ages are
    shown: on the left are estimates (numbers in black) obtained
    with the mutation rate based on recent whole-genome sequencing
    results as described in the main text, and on the right
    are estimates (numbers in gray) based on the higher mutation rate
    used by Cruciani et al.6

    It could still be a very early diverging H. sapiens lineage, as is surely the case of the more recent and slightly more common A0 (former A1b, found in Cameroonian Western Pygmies, 8.3%, and among Algerian Mozabites, 1.5% – see here) but both are in the blurry zone of the time of birth of our species (judging from archaeological and paleoanthropological data) c. 200 Ka ago. The first documented “modern human” skull, Omo 2, is dated to 190 Ka ago and it shares locality with another one, Omo 1, which is rather H. rhodesiensis, so in that “dawn of modern humankind” there was surely not a very clearly drawn line between modern humans or Homo sapiens and archaic humans or Homo rhodesiensis (or whatever). Some of those proto-Sapiens lineages still remain among us at very low levels.

    Their presence may also suggest minor admixture between the first migrant H. sapiens to arrive to Cameroon and their then still close relatives from previous flows, which we don’t consider H. sapiens because we have drawn a convenient, but as we see now somewhat blurry, anthropometric or paleoanthropological line at Omo 2 and later specimens close to us in skull shape. While there is some generic comparability, the fact of admixture between such closely related populations is much less impressive than the one of admixture with Neanderthals or, probably, Homo erectus (non-Neanderthal Denisovan relatives), more distant from us in the tree of Greater Humankind. 
    As for the “molecular clock” estimate I suspect that this one is correct. I would have liked to explain it today but it will have to wait because it is a complex matter and I have been all day writing for this blog, so I am quite tired now.

    Update (Mar 3): Kalupitero commented in another entry that this lineage has very distinctive STR markers and that he has spotted 9 Cameroonians and one French (probably of African ancestry) with it at the Sorenson Molecular Genealogy Foundation database.

    Update (Mar 5): A reader directed me to a free copy of this paper, from where I selected fig. 1 (above) and fig. 3 (below). I realized that the number of sequences detected among the Mbo was not one as I originally said but eight. They also mention that the frequency of this lineage in Africa must be very low: c. 0.19% (CI: 0.11-0.35%).

    Figure 3. Median-Joining Network of A00 Haplotypes
    The network is based on haplotypes (constructed with 95 Y-STRs)
    of eight Mbo and an African American (AA) individual. All mutations
    are assumed to be single step and were given equal weight
    during the construction of the network. Marker names are indicated
    without ‘‘DYS’’ at the beginning.


    See also:


    Khoe-San matrilineages and prehistory

    A most interesting study has just been published that reconstructs the prehistory of the Khoe-San peoples of Southern Africa primarily using mitochondrial DNA analysis but with very important reliance on archaeological data as well.
    Karina M. Schlabusch et al., MtDNA control region variation affirms diversity and deep sub-structure in populations from Southern Africa. BMC Evolutionary Biology 2013. Open accessLINK [doi:10.1186/1471-2148-13-56]

    Abstract (provisional)


    Background

    The current San and Khoe populations are remnant groups of a much larger and widely dispersed population of hunter-gatherers and pastoralists, who had exclusive occupation of southern Africa before the influx of Bantu-speakers from 2 ka (ka = kilo annum [thousand years] old/ago) and sea-borne immigrants within the last 350 years. Here we use mitochondrial DNA (mtDNA) to examine the population structure of various San and Khoe groups, including seven different Khoe-San groups (Ju/’hoansi, !Xun, /Gui+//Gana, Khwe, =Khomani, Nama and Karretjie People), three different Coloured groups and seven other comparative groups. MtDNA hyper variable segments I and II (HVS I and HVS II) together with selected mtDNA coding region SNPs were used to assign 538 individuals to 18 haplogroups encompassing 245 unique haplotypes. Data were further analyzed to assess haplogroup histories and the genetic affinities of the various San, Khoe and Coloured populations. Where possible, we tentatively contextualize the genetic trends through time against key trends known from the archaeological record.

    Results

    The most striking observation from this study was the high frequencies of the oldest mtDNA haplogroups (L0d and L0k) that can be traced back in time to ~100 ka, found at high frequencies in Khoe-San and sampled Coloured groups. Furthermore, the L0d/k sub-haplogroups were differentially distributed in the different Khoe-San and Coloured groups and had different signals of expansion, which suggested different associated demographic histories. When populations were compared to each other, San groups from the northern parts of southern Africa (Ju speaking: !Xun, Ju/’hoansi and Khoe-speaking: /Gui+//Gana) grouped together and southern groups (historically Tuu speaking: =Khomani and Karretjie People and some Coloured groups) grouped together. The Khoe group (Nama) clustered with the southern Khoe-San and Coloured groups. The Khwe mtDNA profile was very different from other Khoe-San groups with high proportions of Bantu-speaking admixture but also unique distributions of other mtDNA lineages.

    Conclusions

    On the whole, the research reported here presented new insights into the multifaceted demographic history that shaped the existing genetic landscape of the Khoe-San and Coloured populations of southern Africa.

    From the reading of the paper, I gather the following chronology (which should be always taken with some caution because of the uncertainty of “molecular clock” methods but in this case they seem reasonably backed from the material/cultural evidence record):
    1. L0d coalescence time estimate may correlate with the arrival of MSA to the region c. 100 Ka ago (I estimated once ~90 Ka, so it is consistent with my thought).
    2. Its sublineage L0d1’2 might have expanded c. 50 Ka ago (I would rather think of a more ancient chronology, soon after the L0d node – they can’t correlate it properly with any obvious archaeological pattern, so it might be, I guess, more related to the apogee of MSA c. 75 Ka ago).
    3. Some L0d1 subclades (notably L0d1a, L0d1b) would have expanded with the transition to LSA (40-20 Ka ago).
    4. L0d2a shows an star-like expansion that they estimate to have happened c. 7-8 Ka ago and would be related to an Epipaleolithic (with microlithic industry) that is also notable for the increase of the density of archaeological findings in South Africa and Lesotho. This lineage also shows secondary expansion with pastoralism later on.
    5. The introduction of herding c. 2000 years ago may have affected the correlations between the various L0d lineages. However most lineages show signs of expansion in this period. The main exception is L0d1a (decrease instead) and to some extent L0d1c (first decrease, later increase probably related to the !Xun late adoption of pastoralism, affecting especially to L0d1c1).
      1. L0d3 is too old to have expanded with pastoralism, so the authors reject  Tatiana Karafet’s hypothesis that it expanded in this period and that it could be related (to most unlikely) linguistic relation between Sandawe and Khoe-San. Instead they suggest (as I did in the past) that L0d3 had an East African distribution instead with only minor spreading to the Khoe-San in relation with pastoralism.
    6. The recent Iron Age (last millennium) arrival of Bantu-speakers absorbed primarily L0d2a, which is the most common lineage of Khoe-San peoples (including Coloureds, with the partial exception of Cape Coloured, where it is second to L0d2b).
    The paper only briefly mentions L0k1, which is most concentrated towards Katanga (D.R. Congo) and may therefore have arrived to Southern Africa only with Bantu or pastoralist flows.
    Frequencies and estimated timelines of major Southern African L0d and L0k lineages (from fig. 4):

    See also:


    Algerian haploid genetics

    This new study has particular interest for data miners willing to dig in the supplemental materials. It also has some other points of interest that I will discuss below and its general approach is loosely alright. However there are many nuances to be discussed in depth on the very complex NW African genetic landscape in which their tentative conclusions seem to lack enough depth of analysis (who grabs too much, squeezes little). Hence the complexity is too big for me to go issue by issue offering a criticism, so I will leave most of that open for the discussion, if the readers wish so.

    Asmadan Bekada et al., Introducing the Algerian Mitochondrial DNA and Y-Chromosome Profiles into the North African Landscape. PLoS ONE 2013. Open accessLINK [doi:10.1371/journal.pone.0056775]
    Mitochondrial DNA
    The mtDNA landscape of Algeria and Northwest Africa is dominated (using HVS-I only to estimate it) by R-CRS (“H/HV” in table S2) with levels of 18-34% (29% in Algeria) almost comparable to Western Europe (~45%). This fraction we know from previous studies to be composed almost only by H1, H3, H4 and H7, all them attributed by Cherni to be originated (judging on diversity) in SW Europe (Iberia, France). Along with them HV0/V (7% in Algeria, 5-9% regionally) must be mentioned as also plausibly to be from that part of Europe (4-7%).
    Another notable lineage is U6 (typical and most diverse in NW Africa), which reaches frequencies of 11% in Algeria (somewhat less in neighboring countries). Outside this area is only notable in Levant (~1%) and Iberia (~1,4%).
    M1 reaching 7% in Algeria (~1-4% elsewhere in NW Africa, <1% in Europe and Highland West Asia, 1.2% in Levant, 2.4% in Peninsular Arabia) is also very much worth a mention, especially because the authors find an specifically NW African node centered in Algeria (HT2):

    Figure 3. Reduced median network relating HVS-1 sequences of subhaplogroup M1.
    (…) Black circles correspond to haplotypes observed in Algeria, whereas grey triangles pentagons correspond to lineages found in Egypt. Haplotype observed both in Algeria and Egypt are indicated using a black triangle. Grey circles indicate haplotypes observed in other geographical regions. (…)
    The pattern suggests an Egypt-centered expansion for this lineage, however notice that East African M1 was not considered. 
    Synthesis of mtDNA haplogroups or paragroups found in NW Africa at frequencies >2.5% (see table S2 for details and the many low frequency lineages as well), nomenclature as in table S2 (but some annotations in [square brackets] by me), frequencies for Algeria first (in brackets NW African range):
    • HV/H[R-CRS]: 28.8% (17.9-34.2%)
    • HV0/HV0a/V: 6.7% (4.6-8.3%)
    • R0a: 0.8% (0.8-3.2%)
    • U3*: 3.2% (1.1-3.2%)
    • U6a[U6a*]: 1.9% (1.9-7.8%)
    • U6a1’2’3: 9.4% (2.6-9.4%)
    • K*: 1.6% (0.7-4.8%)
    • T1a: 3.5% (0.0-5.6%)
    • T2b*: 1.9% (0.0-2.2%)
    • J[*]/J1c/J2[*]: 3.8% (1.3-3.8%)
    • M1[*]: 7.3% (0.7-7.3%)
    • L3b[*]: 0.3% (0.3-2.8%)
    • L3b1a3: 1.3% (0.0-2.8%)
    • L3e5: 1.6% (0.0-2.9%)
    • L2*: 0.5% (0.0-4.1%)
    • L2a[*]: 0.8% (0.0-3.2%)
    • L2a1*: 1.3% (0.7-4.8%)
    • L2a1b: 1.3% (0.8-3.5%)
    • L2d: 0.0% (0.0-2.8%)
    • L1b*: 3.0% (2.7%-9.0%)
    Notice that in nearly all cases L(xM,N) highest frequency correspond to West Sahara. The exceptions are L2a* (Tunsian “Andalusians”) and L3e5 (Tunisians), suggesting maybe a local NW African deep rooting rather than ancient or recent flows from Tropical Africa. There are other lineages in the low frequency range in similar situation.
    For this and other reasons I decided to color-code the list above according to my best guess about the origin of each lineage: NW African in deep red, Tropical African in brown, Egyptian in light brown, West Asian in green and European in blue. Unclear cases I left in black type.
    Y chromosome DNA
    Algerian and NW African Y-DNA is overwhelmingly dominated by E1b1b1b (M81), reaching 44% in Algeria (44-67% in the region), which is a NW African specific lineage. The second most important lineage by frequency is J1 (M304) with 22% in Algeria (0-22% in the region, 6-22% if we exclude Libya). None of the rest of the lineages reaches 7%, excepted E1b1b1c (M123) but only in West Sahara (11%, elsewhere it is very minor).
    List of Y-DNA haplo-/paragroups with frequencies above 2.5% anywhere in NW Africa follows (based on table S6). Same notation as with mtDNA (Algerian frequency first, NW African range in brackets):
    • E1a (M33): 0.6% (0.0-5.3%)
    • E1b1[*] (P2): 5.2% (0.7-38.6%)
    • E1b1b1[*] (M35): 0.6% (0.0-4.2%)
    • E1b1b1a4 (V65): 1.9% (0.0-4.8%)
    • E1b1b1b (M81): 44.2% (44.2-67.4%)
    • E1b1b1c (M123): 1.3% (0.0-11.1%)
    • F[*] (M89): 3.9% (0.0-3.9%)
    • J1 (M267): 21.8% (0.0-21.8%)
    • J2a2 (M67): 3.9% (0.0-3.9%)
    • R1b1a (V88): 2.6% (0.9-6.9%)
    • R1b1b1a1b[*] (U198): 2.6% (0.0-2.6%)
    • R1b1b1a1b1 (U152): 2.6% (0.0-2.6%)
    For more diverse samples of NW African Y-DNA (from previous studies), Wikipedia has a nice table.
    I would like to highlight the problematic of J1 in Africa in general (including NW Africa). While there is no reasonable doubt that J1 as a whole originated in West Asia, it is found at rather high frequencies in East/NE Africa (Sudan, the Horn, Upper Egypt) and NW Africa with only very limited (at best) company by J2. Instead West Asian populations show a much more balanced apportion of the two major J sublineages, even in Saudi Arabia the J1:J2 proportion is of 8:3, almost 2:1. We do see this kind of apportioning in Lower Egypt, suggesting a “recent” (Neolithic or later) demic colonization from West Asia but we see exactly but nowhere else in Africa, where J1 is found always much more frequently than J2 (if the latter is found at all). 
    In my understanding this excludes colonization from West Asia after the Pre-Pottery Neolithic B, which seems the most plausible scenario for the spread of “Highlander” J2 into “Lowland” West Asia (probably dominated by J1 initially). So J1 in Africa (excepted Lower Egypt) cannot be argued easily to be of “recent” Neolithic, much less Semitic or Arab origin: it must be older. 
    Also Ethio Helix commented in this very interesting discussion at his blog that Tofanelli 2009 found low diversity on NW African J1. However, to my knowledge, nobody has looked at NE/East African J1 diversity nor a proper study has been done on the substructure of this lineage in Africa. This leaves wide open the possibility that NW African J1 has a NE African origin, surely related to the expansion of Capsian culture or internal African Neolithic flows. 
    While this matter is not properly addressed, researchers will oversimplify and imagine J1 as simply West Asian influx. It is ultimately of course but I strongly suspect that it has a secondary and distinct NE African center at the Nile basin and this is being totally ignored. 
    Comparisons
    This study offers several rough comparisons with nearby regions (but not West Africa), however they oversimplify some stuff (the already mentioned Y-DNA J1 or assigning all mtDNA L(xM,N) to East Africa, when it seems obvious that some lineages may be deeply rooted in NW Africa or others probably come from West Africa). For whatever it is worth anyhow, here there are two such questionable comparisons:

    Table 2. Geographic components (%) considered in Y-chromosome and mtDNA lineages.

    Figure 2. Graphical relationships among the studied populations.
    PCA plots based on mtDNA (a) and Y-chromosome (b) polymorphism. Codes are as in Supplementary Tables S2 and S6.

    See also:

     
    48 Comments

    Posted by on February 23, 2013 in African genetics, mtDNA, North Africa, West Eurasia, Y-DNA