RSS

Category Archives: European prehistory

Grotte Chauvet’s Aurignacian dates strongly questioned

The famous rock art of the Cave of Lions (Grotte Chauvet, Ardèche) seems now not to be of such an early date as was claimed by Valladas et al. in 2001 but rather from the Gravettian and Solutrean periods, with more solid dates between 26,000 to 18,000 BP.
Jean Combier & Guy Jouve, New investigations into the cultural and stylistic identity of the Chauvet cave and its radiocarbon dating. L’Anthropologie 2014. Pay per view → LINK [doi:10.1016/j.anthro.2013.12.001]

Abstract


The discovery of Chauvet cave, at Vallon-Pont-d’Arc (Ardèche), in 1994, was an important event for our knowledge of palaeolithic parietal art as a whole. Its painted and engraved figures, thanks to their number (425 graphic units), and their excellent state of preservation, provide a documentary thesaurus comparable to that of the greatest sites known, and far beyond what had already been found in the group of Rhône valley caves (Ardèche and Gard). But its study – when one places it in its natural regional, cultural and thematic framework – makes it impossible to see it as an isolated entity of astonishing precocity. This needs to be reconsidered, and the affinities that our research has brought to light are clearly incompatible with the very early age which has been attributed to it. And if one extends this examination to the whole of the Franco-Cantabrian domain, the conclusion is inescapable: although Chauvet cave displays some unique characteristics (like every decorated cave), it belongs to an evolved phase of parietal art that is far removed from the motifs of its origins (known from art on blocks and on shelter walls dated by stratigraphy to the Aurignacian, in France and Cantabrian Spain). The majority of its works are therefore to be placed, quite normally, within the framework of the well-defined artistic creations of the Gravettian and Solutrean. Moreover, this phase of the Middle Upper Palaeolithic (26,000–18,000) coincides with a particularly intensive and diversified local human occupation, unknown in earlier periods and far less dense afterwards in the Magdalenian. A detailed critique of the treatment of the samples subjected to AMS radiocarbon dating makes it impossible to retain the very early age (36,000 cal BP) attributed by some authors to the painted and engraved figures of Chauvet cave.


SW Iberian plaques from the Chalcolithic

A new study gives us the opportunity to learn about the mysterious SW Iberian plaques from the Chalcolithic period.
Daniel García Rivero & Daniel J. O’Brien, Phylogenetic Analysis Shows That Neolithic Slate Plaques from the Southwestern Iberian Peninsula Are Not Genealogical Recording Systems. PLoS ONE 2014. Open access LINK [doi:10.1371/journal.pone.0088296]

Abstract


Prehistoric material culture proposed to be symbolic in nature has been the object of considerable archaeological work from diverse theoretical perspectives, yet rarely are methodological tools used to test the interpretations. The lack of testing is often justified by invoking the opinion that the slippery nature of past human symbolism cannot easily be tackled by the scientific method. One such case, from the southwestern Iberian Peninsula, involves engraved stone plaques from megalithic funerary monuments dating ca. 3,500–2,750 B.C. (calibrated age). One widely accepted proposal is that the plaques are ancient mnemonic devices that record genealogies. The analysis reported here demonstrates that this is not the case, even when the most supportive data and techniques are used. Rather, we suspect there was a common ideological background to the use of plaques that overlay the southwestern Iberian Peninsula, with little or no geographic patterning. This would entail a cultural system in which plaque design was based on a fundamental core idea, with a number of mutable and variable elements surrounding it.

Figure 1. Engraved plaques from the Iberian Peninsula.
a,
Valencina de la Concepción, Sevilla, Spain (Museo Arqueológico de
Sevilla [MAS]); b, S. Geraldo, Montemor-o-Novo, Évora, Portugal (Museo
Nacional de Arqueologia de Portugal [MNAP]); c, Monsaraz, Reguengos de
Monsaraz, Évora (MNAP); d, Mora, Évora (MNAP); e, Jabugo, Aracena,
Huelva, Spain (MAS); f, Ciborro, Monte-o-Novo, Évora (MNAP); g, Marvão,
Portalegre, Portugal (MNAP); h, Estremoz, Évora (MNAP); and I, Pavia,
Mora, Évora (MNAP).

Rather than dwelling in the central discussion of the study, which is to empirically discard the genealogical hypothesis (for which it is surely best to read the paper as such), my main interest is to share this not often seldom discussed Chalcolithic phenomenon which is limited to SW Iberia (i.e. Southern Portugal and nearby areas of Spain). This study gives us the opportunity of not just knowing it but also contemplate its unity and diversity from a large number of specimens. 

Fig. 2 –  General design of the plaques.
The dates of the “plaque idols”, as they are often known in the literature, range from c. 2650 to c. 2100 BCE[see note below], corresponding to the development of the first Iberian (and West European) civilizations (fortified towns) in the area, which began c. 2600 BCE, with two main centers around modern Lisbon (Zambujal) and Almería (Los Millares) but that also knew of other such towns especially in Southern Portugal. All that in the context of dolmenic Megalithism, with the introduction of new burial designs such as the tholos (beehive tomb) or the artificial cave, innovations that may have been restricted for some elites. 

Important note (update Feb 25): the dates given in the previous paragraph are uncalibrated (i.e. raw BP minus 1950). The calibrated dates are quite older: between c. 3500 and 2600 “actual years” BCE, as you can check in table 1. They still overlap with the known dates for Los Millares (c. 3200–2300 BCE) and its “Almeriense” precursor culture but less so with Zambujal (c. 2600-1300 BCE, subject to possible revisions). My apologies for the confusion.

The most dense area, and seemingly also the most diverse, for this kind of findings is the southern part of Évora district (Central Alentejo, near the Guadiana River, known as River Ana in Antiquity), a mostly flat country with some low hills (the highest peak in the district has 600 m.) and a scattered natural forestry of corks and holm oaks. It was once known as Portugal’s “bread basket” and was surely of relevance in the Neolithic and Chalcolithic period, especially in relation with the development of the influential burial style of dolmens or cairns (known as mamoas in Portuguese), later partly replaced by tholoi.

Typical Alentejo landscape (CC by Alvesgaspar)

The plaques’ phenomenon is anyhow found through all the Southern half of Portugal, with limited penetration into Spanish Extremadura. Another important region was the Lisbon Peninsula, which was almost certainly a more important civilization and geopolitical center, with notable urban development in this period and becoming a major center of Bell Beaker.
Its main city, Zambujal (Torres Vedras) still barely researched was connected to the Atlantic Ocean by a 10-14 km long marine branch that was silted (tsunami?) at the end of its occupation (end of Bronze Age?) Hence we are talking of a major city (for the standards of the time at least) which lasted for more than a thousand years and whose influence encompassed once at the very least much of Southwestern Europe (and, if we accept that it was at the origins of the Bell Beaker, then all Western Europe and parts of North Africa).

Ruins of Zambujal (source)
Reconstruction of the known area of Zambujal, possibly just an acropolis (source)
Figure 3. Character states used in the analysis.

Back to the plaques, I don’t feel able to say anything about them that is not in the paper (read it and browse the many figures, please), except for one thing: some of the characteristics of certain plaques compare well with other “religious” iconography from the Southern Iberian Peninsula in Chalcolithic times.

For example plaque A in figure 1 clearly has the “oculado” (eyed) symbol found in many other artistic elements of the time and believed to represent some divinity and very likely representing the eyes of an owl (suspected to have been an ancient divinity or divine symbol in much of Europe, and found also in India).

“Oculado” symbol in a bowl from Los Millares (CC by José-Manuel Benito Álvarez)
An “oculado” idol (CC by Luis García (Zaqarbal))
Proto-Chorintian owl (public domain, credit: Jastrow)

Other plaques with a more defined head (plaque G in fig. 1, NK2 in fig. 3), remind also to the Millarense “cruciform” idols:

(CC Museo de Almería)
Diverse types of idols from Chalcolithic Iberia (source)
So I would think that all or at least many may well represent the same kind of divinity, possibly related to the origins of several more historical deities such as Athena (Greece) or Mari (Basque Country). 
 

Neolithic peoples from Britain and Ireland ate a lot of dairies and nearly no fish

I just discussed again the genetic sweep that apparently has happened in Europe after the Neolithic strongly favoring the selection of alleles that allow the digestion of lactose (the sugar present in milk and often in other dairies) by adults. However our knowledge of ancient European genetics is probably not sufficient (nor that of lactose tolerance genetics) and in any case the question remains, where did those lactase persistence (LP) alleles come from if all ancient Neolithic remains test negative?
An interesting possibility is opened by another recent study, not at all genetic in nature but rather bio-archaeological:
Lucy J. E. Cramp et al., Immediate replacement of fishing with dairying by the earliest farmers of the northeast Atlantic archipelagos. Proceedings of the Royal Society B 2014. Open accessLINK [doi:10.1098/rspb.2013.2372]

Abstract


The appearance of farming, from its inception in the Near East around 12 000 years ago, finally reached the northwestern extremes of Europe by the fourth millennium BC or shortly thereafter. Various models have been invoked to explain the Neolithization of northern Europe; however, resolving these different scenarios has proved problematic due to poor faunal preservation and the lack of specificity achievable for commonly applied proxies. Here, we present new multi-proxy evidence, which qualitatively and quantitatively maps subsistence change in the northeast Atlantic archipelagos from the Late Mesolithic into the Neolithic and beyond. A model involving significant retention of hunter–gatherer–fisher influences was tested against one of the dominant adoptions of farming using a novel suite of lipid biomarkers, including dihydroxy fatty acids, ω-(o-alkylphenyl)alkanoic acids and stable carbon isotope signatures of individual fatty acids preserved in cooking vessels. These new findings, together with archaeozoological and human skeletal collagen bulk stable carbon isotope proxies, unequivocally confirm rejection of marine resources by early farmers coinciding with the adoption of intensive dairy farming. This pattern of Neolithization contrasts markedly to that occurring contemporaneously in the Baltic, suggesting that geographically distinct ecological and cultural influences dictated the evolution of subsistence practices at this critical phase of European prehistory.

Not only fish consumption was pretty much abandoned in Britain and Ireland with the arrival of Neolithic (only recovered under Viking influence many millennia later) but the most striking fact is that it was replaced by milk as main source of proteins. 
This fact, considering that farmers studied in Central Europe and Iberia have systematically tested negative for lactase persistence, really opens an avenue for the possible origins of this nutritional adaptation because it is most unlikely that they were such notable dairy consumers without the corresponding digestive ability (even cheese may be harmful to lactose intolerant people unless it is aged, while yogurt was almost certainly not known yet in Europe). 
While the evidence comes from the Atlantic Islands, it is worth to notice that their chronologically late Neolithic has its origins in the much older agricultural cultures of NW France, another blank spot in the ancient DNA map of Europe. Nowadays NW France is high but not particularly high in this phenotype but SW France and Basques have among the highest LP scores (both phenotype and rs4988235(T) genotype) in Europe, together with the Atlantic Islands and Scandinavia. 
Then again it is worth recalling that one of the first areas where the rs4988235(T) allele is found is in the southern areas of the Basque Country, with clear signs of two different populations (one lactose tolerant and the other lactose intolerant) being still in the first stages of contact and mostly unmixed.
This leads us to the issue of Atlantic Megalithism (tightly associated to Atlantic Neolithic) and its still unsolved, but likely important, role in the conformation of the modern populations of Europe. 
Whatever the case the first farmers of the islands were heavy dairy consumers, although in Britain (but not in Ireland and Man) they eventually derived into heavy meat eaters later on:

Figure 1.

Prevalence of marine and dairy fats in prehistoric pottery determined from lipid residues. (af) Scatter plots show δ13C values determined from C16:0 and C18:0 fatty acids preserved in pottery from northern Britain (red circles), the Outer Hebrides (yellow circles) and the Northern
Isles of Scotland (blue circles), dating to (a) Early Neolithic, (b) Mid/Secondary expansion Neolithic, (c) Late Neolithic, (d) Bronze Age, (e) Iron Age and (f) Viking/Norse. Star symbol indicates where aquatic biomarkers were also detected. Ellipses show 1 s.d. confidence ellipses
from modern reference terrestrial species from the UK [19] and aquatic species from North Atlantic waters [13]. (gi) Maps show the frequency of dairy fats in residues from Neolithic pottery from (g) Early Neolithic, (h) the Middle Neolithic/Secondary expansion and (i) Late Neolithic. Additional data from isotopic analysis of residues from Neolithic southern Britain (n = 152) and Scotland (n = 104) are included [19,20].

The data of this study also suggests that the so much hyped high-meat “Paleolithic diet” is more of a Late Neolithic (Chalcolithic) thing, with the real hunter-gatherers of Europe being more into fish in fact.

Correction: I wrongly reported the main European lactase persistence SNP as rs13910*T, when it is in fact rs4988235(T) (already corrected in the text above) This was caused by the nomenclature used in the Sverrisdóttir paper, where it refers to it as -13910*T, which must be some other sort of naming convention. Thanks to Can for noticing.


The oldest human footprints in Europe

By now I’m sure that the vast majority of readers of this blog, if not all, have already read the news about the Happisburg footprints, of almost one million years age, which are coincident with the earliest known dates for archaic human presence in Europe based on other archaeology (H. ergaster or antecessor) and extend their range quite further northwards. So I just want to post a reference, as the study is freely available online for all to read.

Nick Ashton et al., Hominin Footprints from Early Pleistocene Deposits at Happisburgh, UK. PLoS ONE 2014. Open accessLINK [doi:10.1371/journal.pone.0088329]

Abstract

Investigations at Happisburgh, UK, have revealed the oldest known hominin footprint surface outside Africa at between ca. 1 million and 0.78 million years ago. The site has long been recognised for the preservation of sediments containing Early Pleistocene fauna and flora, but since 2005 has also yielded humanly made flint artefacts, extending the record of human occupation of northern Europe by at least 350,000 years. The sediments consist of sands, gravels and laminated silts laid down by a large river within the upper reaches of its estuary. In May 2013 extensive areas of the laminated sediments were exposed on the foreshore. On the surface of one of the laminated silt horizons a series of hollows was revealed in an area of ca. 12 m2. The surface was recorded using multi-image photogrammetry which showed that the hollows are distinctly elongated and the majority fall within the range of juvenile to adult hominin foot sizes. In many cases the arch and front/back of the foot can be identified and in one case the impression of toes can be seen. Using foot length to stature ratios, the hominins are estimated to have been between ca. 0.93 and 1.73 m in height, suggestive of a group of mixed ages. The orientation of the prints indicates movement in a southerly direction on mud-flats along the river edge. Early Pleistocene human fossils are extremely rare in Europe, with no evidence from the UK. The only known species in western Europe of a similar age is Homo antecessor, whose fossil remains have been found at Atapuerca, Spain. The foot sizes and estimated stature of the hominins from Happisburgh fall within the range derived from the fossil evidence of Homo antecessor.

Figure 8. Vertical image of Area A at Happisburgh.
a. Model of footprint surface generated from photogrammetric survey showing the 12 prints used in the metrical analyses of footprint size; b. Plot of length and width measurements of 12 prints showing possible individuals. Means and standard deviations for foot length and age for modern populations are also shown.
 
1 Comment

Posted by on February 15, 2014 in European prehistory, Homo ergaster, Middle Paleolithic, UK


Neolithic and Chalcolithic demographics of Western and Northern Europe

Somehow I missed this important study on the Neolithic and Chalcolithic demographics of Europe, as inferred from the archaeological record (h/t Davidski):
Stephen Shennan et al., Regional population collapse followed initial agriculture booms in mid-Holocene Europe. Nature Communications 2013. Open accessLINK [doi:doi:10.1038/ncomms3486]

Abstract

Following its initial arrival in SE Europe 8,500 years ago agriculture spread throughout the continent, changing food production and consumption patterns and increasing population densities. Here we show that, in contrast to the steady population growth usually assumed, the introduction of agriculture into Europe was followed by a boom-and-bust pattern in the density of regional populations. We demonstrate that summed calibrated radiocarbon date distributions and simulation can be used to test the significance of these demographic booms and busts in the context of uncertainty in the radiocarbon date calibration curve and archaeological sampling. We report these results for Central and Northwest Europe between 8,000 and 4,000 cal. BP and investigate the relationship between these patterns and climate. However, we find no evidence to support a relationship. Our results thus suggest that the demographic patterns may have arisen from endogenous causes, although this remains speculative.

The most interesting aspect is maybe that the (apparent) demographic changes are detailed for many regions of Europe, but first let’s see the general outlook for the whole area surveyed (Western and Northern Europe, Iberia excluded):

Figure 2: SCDPD-inferred population density change 10,000–4,000 cal. BP using all radiocarbon dates in the western Europe database.
Colored arrows and their annotations are mine.

I decided that it was important to mark the main cultural episodes for reference.
1st Neolithic refers to Impressed-Cardium and Linear Band Pottery cultures, which arrived almost simultaneously to Germany and France (of the surveyed areas), although the Rhône-Languedoc Neolithic is a few centuries earlier than the arrow, which has been standardized to 7500 BP.
Atlantic Neolithic refers to the quite belated arrival of Neolithic to Britain, Ireland and Northern Europe (standardized at 6000 BP). This process was quickly followed and tightly associated with the widespread cultural phenomenon of Dolmenic Megalithism. It is most interesting that the main deviation from the pattern of regular growth concentrates in this period and is clearly positive.
Corded Ware culture (Indoeuropean consolidation in Central and Northern Europe) affected only to Germany and Denmark-Scania within the surveyed regions. It was followed by a more widespread subcultural phenomenon known as Bell Beaker, which almost invariably cases manifests within pre-existent locally rooted cultures. Neither seems to be correlated with demographic expansions in the general overview.
Now let’s take a look at the regional graphs:

Figure 3: SCDPD-inferred population density change 8,000–4,000 cal. BP for each sub-region.
Colored arrows, excepted the blue ones (which mark the local first Neolithic), are mine and mark general pan-European initial chronologies (not local!) for Megalithism, Corded Ware and Bell Beaker in those regions where they had some clear influence.

Here we can appreciate that:
Atlantic Neolithic and its associated Megalithic phenomenon are clearly related to notable demographic expansions in Ireland, Scotland, South England, Denmark and Scania. Megalithic influence may also be associated with some more irregular growth in South and Central Germany but rather not in France nor West Germany. A contemporary weak and irregular growth in North Germany (Brandenburg, Mecklemburg and Schlewig-Holstein) may be correlated with Funnelbeaker (with roots in Denmark) and the first Kurgan development of Baalberge and successor cultures (with roots in Eastern Europe), which would eventually evolve into Corded Ware.
Corded Ware only seems related to clear demographic growth in Jutland (and less resolutely in Scania). Bell Beaker is only linked with clear demographic growth in Ireland (and much more weakly in South England and Central Germany), while elsewhere it is rather associated with decline.
For the exact extension of the various regions as defined for this study, see fig. 1 (map).
As provisional conclusion, it seems obvious to my eyes that the most important demographic growth processes were the various Neolithic cultures but that the Atlantic Neolithic (and associated Megalithism) was particularly dynamic. In contrast Indoeuropean-associated cultural phenomena had a much weaker impact, with some localized exceptions, and are generally associated with local demographic decline instead, at least judging from the archaeological record.
See also:
 

La Braña 1 carried the very rare Y-DNA haplogroup C (possibly C6-V20)

La Braña 1 without makeup
(Check for the updates below, please).

The late Epipaleolithic forager from NW Iberia (previously discussed here) had the patrilineal haplogroup C6, found so far only very rarely among modern Europeans (Scozzari 2012). This, I must say, I know by the moment only from secondary sources (Eurogenes, Dienekes and a personal communication) because I have not been able yet to put my hands on the relevant paper and this key detail is not mentioned in the abstract.

Iñigo Olalde et al., Derived immune and ancestral pigmentation alleles in a 7,000-year-old Mesolithic European. Nature 2014. Pay per viewLINK [doi:10.1038/nature12960]

freely available supplementary materials.


Abstract

Ancient genomic sequences have started to reveal the origin and the demographic impact of farmers from the Neolithic period spreading into Europe1, 2, 3. The adoption of farming, stock breeding and sedentary societies during the Neolithic may have resulted in adaptive changes in genes associated with immunity and diet4. However, the limited data available from earlier hunter-gatherers preclude an understanding of the selective processes associated with this crucial transition to agriculture in recent human evolution. Here we sequence an approximately 7,000-year-old Mesolithic skeleton discovered at the La Braña-Arintero site in León, Spain, to retrieve a complete pre-agricultural European human genome. Analysis of this genome in the context of other ancient samples suggests the existence of a common ancient genomic signature across western and central Eurasia from the Upper Paleolithic to the Mesolithic. The La Braña individual carries ancestral alleles in several skin pigmentation genes, suggesting that the light skin of modern Europeans was not yet ubiquitous in Mesolithic times. Moreover, we provide evidence that a significant number of derived, putatively adaptive variants associated with pathogen resistance in modern Europeans were already present in this hunter-gatherer.

Relevance for the overall understanding of macro-haplogroup C
Until the discovery of this C6 lineage, there were some strong reasons to suspect that Y-DNA C may have coalesced already in SE Asia or, at least, very close to it, with its subclades forming by pairs a three pointed star with geographical center in that area: C1 and C3 in NE Asia (and America), C2 and C4 in Wallacea and Australasia and C5 and some rather homogeneous C* in India.
The discovery of this C6 lineage and its confirmation as a Paleolithic one in Europe (i.e. not a “recent” arrival from somewhere else) add phylogenetic weight to the Western geography of haplogroup C, one of two main subdivisions of the main non-African Y-DNA lineage CF. However we cannot yet reach to conclusions about the “exact” origins of C because the macro-lineage still awaits improvement of its phylogenetic structure at the basal levels.
In plain language: it is quite likely that C2 and C4 form a monophyletic clade and I would not be surprised at all if C1 and C3 do the same. But then it is also possible that C5 and the Indian C* and/or the European C6 also form their own distinct branches. It is even possible that some of these lineages are related across subcontinental regions, as was recently found within MNOPS (aka K(xLT)). So we need first to know how they relate with each other a the top phylogenetic level before we can rush to any conclusion. In any case the discovery of C6 adds some preliminary weight to the hypothesis of C coalescing when still in South Asia.


Pigmentation genetics

There have been some rush to conclusions on the pigmentation of this and another Western European hunter-gatherer based only on genetics. I think that some of the conclusions are most likely incorrect, at least to some extent, because they are based on a SNP which only weights ~15% on skin coloration.

Judging on the figures (freely accessible, it seems), La Braña 1 carried two pigmentation alleles of gene SLC45A2 now rare among Europeans (but common elsewhere, i.e. the ancestral variant):

  • rs16891982, which affects hair color (7x chances of black hair among Europeans)
  • rs1426654, which affects skin pigmentation to some degree (correlated with skin color in Indians, irrelevant among modern Europeans because of fixation, weights only ~15% in Cape Verdeans’ skin coloration). 

Notice that while you can find online reconstructions that give La Braña 1 a very dark coloration, this is not necessarily the case at all but rather an oversimplistic  interpretation based only on one allele, allele that is not just dominant in West Asians and Europeans but also, for example, among Gujaratis, who are quite dark for European standards.

    It seems correct anyhow that this allele was only brought to Europe with Neolithic farmers (Stuttgart had it) but its alleged effect on pigmentation seems very much exaggerated.

    Fig. 4 from Beleza 2013 highlights that no single gene is decisive in skin pigmentation.

    It is probable anyhow that La Braña 1 had black hair.
    It is much more plausible that he had blue eyes because these are much more directly regulated by simple genetics.
    Continuity of immunity genetics
    La Braña 1 also had three immunity related alleles (derived variants) that have been retained at least to some extent by modern Europeans:
    • rs2745098 (PTX4)
    • rs11755393 (UHRF1BP1, related to lupus)
    • rs10421769 (GPATCH1)
    Comparison with global populations
    Fig. 5 (ED) offers various comparisons of La Braña 1 and Mal’ta 1 (from Siberia) with modern humans from around the World:

    Extended Data Figure 5: Pairwise outgroup f3 statistics.
    a, Sardinian versus Karitiana. b, Sardinian versus Han.
    c, La Braña 1 versus Mal’ta. d, Sardinian versus Mal’ta.
    e, La Braña 1 versus Karitiana. The solid line represents y = x.
    We can see in them that, La Braña 1 clusters well with modern Europeans, while Mal’ta instead strongly tends towards other Asians, often clustering with Pakistanis (“Central/South Asia” metapopulation).
    Maybe the most interesting graph is c, where we can see how the various populations deviate from the y=x line in the direction of La Braña (Europeans, West Asians) or Mal’ta (Native Americans particularly).
    Comparison with Neolithic samples and modern Europeans

    Extended Data Figure 4: Allele-sharing analysis.
    Each panel shows the allele-sharing of a particular Neolithic sample from refs 1 and 3 with La Braña 1 sample. The sample IDs are presented in the upper left of each panel (Ajv52, Ajv70, Ire8, Gok4 and Ötzi). In the upper right of each panel, the Pearson’s correlation coefficient is given with the associated P value.

    In all cases Swedes (SE), followed by Polish (PL), etc. share the greatest amount of alleles with La Braña 1, although I’m not sure if the differences are really that relevant (is really 69.3% significantly different from 68.7%?)
    In the vertical scale we can observe how the various populations tend more or less strongly towards various Neolithic samples (again with the same doubts about the significance of the differences). In the first row they are compared with Götland’s Pitted Ware individuals (of plausible Eastern European origins: strong cultural connections with Dniepr-Don Neolithic). Here Central Europeans show the greatest affinity with Ajv52 and Ajv70 (Basques Bulgarians also score high). There are some differences in the case of individual Ire8, whose closest modern relatives seem to be the Dutch. Swedes only score high re. Ajv52 but low to the others, while Finns score neutral-to-low relative to all them.
    The lower row compares with to mainstream Neolithic samples: Gok4 was a Megalithic farmer from SW Sweden and Ötzi was a Chalcolithic shepherd from Southern Tirol. The Swedish farmer is best approached by the Dutch, followed by various West-Central Europeans, while Basques Bulgarians, Finns and Swedes score low here. In the case of Ötzi nobody scores particularly high (some tendency in Switzerland and nearby areas), while Finns score clearly low.
    And that’s all I can say without direct access to the study. Enjoy.

    Update: I already got the paper (thanks again to the donor), I’ll see to update as need be once I have time to read it. Minor urgent edits above in red (and slashed out text).

    Update (Jan 29): The supplementary data is freely available (LINK) but I could not find it earlier. Almost all the information is in it, including a long list, much longer than mentioned above, of the SNPs found in La Braña 1, compared to various modern population frequencies. I don’t have time right now to dwell on it but I guess from a first read that I will have to amend some comments made on the issue of pigmentation above.

    Regarding the Y-DNA haplogroup, it is important to notice that its adscription withing haplogroup C seems very clear but its assignation to C6-V20 is more dubious because of the low quality of the genome. Only the V20 marker could be assigned, so the authors themselves are in doubt and wonder if it could alternatively be C* or C5, both with a South Asian affinity.

    In this sense I think it is worth noticing that the reference Y-DNA site ISOGG has recently revised the phylogeny of macro-haplogroup C and that they have already renamed C6-V20 as C1a2, making it a relative of the minor Japanese lineage earlier known as C1 (now renamed to C1a1), similarly South Asian C5-M356 has been renamed to C1b. So C1 is now perceived as a lineage that spans all Eurasia with an arguable South Asian centrality.

    Another (Papuan?) lineage once known as “C6” has long vanished from the phylogeny because of lack of plural samples, I understand.


    Is the ability to digest milk in Europeans caused by ancient social inequality?

    I’ve got involved these days in a discussion at Dienekes’ Anthropology Blog on the causes of lactase persistance (LP), i.e. the ability to digest milk as adults, in Europe. 
    The discussion orbits around a recent pay-per-view study by O.O. Sverrisdóttir, which claims, with some soundness for what I can discern, that LP in Europeans must have gone through positive selection. 
    Actually the study, as most of its kind, deals only with one LP marker, the well known SNP rs4988235, whose T variant allows adults (in dominant fashion) to digest milk, an ability often lost after weaning. 
    As I discussed back in 2010, there must be other such SNPs because actual LP phenotype only partly corresponds with the known LP alleles. But for whatever is worth, this is the (2010) “known allele” LP map:
    In Europe at least, it essentially corresponds with the T variant of rs49235, which concentrates in Scandinavia, Atlantic Islands and the Basque/SW French area. 
    At first I boarded the discussion with perplexity, because, even if the positive selection argument seems sound, it seems hard to find a reason for it: milk is not such a “great” source of food, excepting the issue of calcium and a high content of protein and fat, and the occasional claims that it is related to vitamin D deficiency seem extremely feeble because this vitamin is present at extremely low frequencies in natural milk, being rickets (where milk’s extra calcium could play some role) only a “less important” side effect of vitamin D deficiency, because its main harmful effect is to impair early brain development, a most serious problem for which calcium seems quite meaningless. So why would the ability to digest milk would have become such a matter of life or death to be actively selected for generation after generation until near-fixation?
    A key piece of information is that not a single sequenced Neolithic farmer has ever been found to carry the relevant LP allele (being all CC) and only since Chalcolithic we begin to find some TT and CT individuals. These are found in Sweden and in the southern areas of the Basque Country (see here for a lengthier discussion):
    • In Götland (Pitted Ware culture) only 1/20 alleles was T (i.e. 1/10
      persons had the CT combo, all the rest being CC and therefore likely
      lactose intolerants). 
    • In Longar (Navarre, dated to c. 4500 BP)
      1/7 individuals was TT, while the other six were CC (intolerant). There
      were no CT cases.
    • In San Juan Ante Porta Latinam (SJAPL, Araba, dated to c. 5000 BP), 4/19 were TT, 2/19 were CT, while the remaining 13 were CC.
    In the Basque cases we can appreciate that there must have already been two different populations regarding this SNP, because the CT cases are rare, implying that the two groups were only beginning to mix. It is worth mentioning that the Basque sites are odd in several aspects: on one side they seem to be military cemeteries (mostly males, arrow injuries and arrow points) and, on the other, they are rather exceptional in the Basque historical sequence of mtDNA pools (a lot more K and some other lineages than usual, less H and U).
    But a key finding in this study is that a Neolithic sequence from Atapuerca (near Burgos city, historical Basque SW border) was again CC for the relevant SNP (and therefore likely lactose intolerant). So it is very possible that proto-Basques did not have the T allele in notable frequencies either (although I keep some reservations for lack of larger samples).
    Whatever the case, if the T allele was selected positively as it seems, there must be a powerful reason for it. Was it cows, as some have claimed a bit too vehemently? I doubt it. 
    Why? Because for all we know from the Middle Ages, a period very similar in many aspects to the Metal Ages, it were goats and not cows the main providers of milk. This makes total sense because the hardy goats are rather inexpensive to rear, while cows are more costly and were often reserved for traction jobs. In most cases, cow produce, be it milk or meat, was an expensive luxury apt only for the upper echelons of a society that was becoming more and more hierarchical and unequal since precisely the Chalcolithic period. 
    Some oral accounts I have heard tell that not so long ago “acorn bread and goat milk” were often staple for the poor. In other areas maybe it was not acorn bread but, say, oat meal (or whatever else), but almost certainly the milk came almost invariably from goat udders, which very efficiently transform leaves and almost any vegetable, even thorny ones, into milk (and meat) for our consumption.
    It is crucial to understand that only if milk was a key survival staple, LP would have become fixated. Otherwise people would have preferred alternative foods and survived in similar shape, so positive selection would never have happened at this locus (non-LP individuals would have survived easily, selection would never have happened or would have been mild enough to retain much greater diversity). 
    It is also crucial to understand that, for all we know, this positive selection only happened since the Chalcolithic, i.e. when social stratification, inequality and private aristocratic property became common. Obviously the upper classes (or castes) had no problems accessing high quality foods, including meat, but the masses probably had growing problems in this aspect as the land and cattle became more and more concentrated in few hands. 
    Even where a wide class of free peasants existed, as was probably the case in much of Atlantic Europe, these were surely often not well-off enough to afford dairy cows. Instead goats would have been available for almost everybody, even the poorest of farmers. And very likely they were the only steady supply of proteins and fat, mostly via milk.
    Plausibly this need of extra nutrients of animal origin was more intense in the Atlantic areas of Europe because cereals do not perform so well in the prevalent humid conditions. Also before the medieval development of the heavy plough, the deep Atlantic soils were not at all as productive as they are now (and that’s why NW Europe only got its economic prominence in the last millennium, being before a peripheral area to the much more productive Mediterranean climate). 
    But climatic and agricultural issues aside, I strongly suspect that the main driver of LP positive selection, were goats, because these and their dairy produce were almost certainly available for almost everyone and, in the Metal Ages, the vast majority of people were farmers, often rather poor peasants who had to rely on their goats for survival, very especially in the bad times.
    I really do not see any other explanation that fits the data.

    PS- This social inequality & goats argument makes sense assuming that the positive selection theory is correct. However before I fully embrace it, I would need a half-decent sample of aDNA sequences from the Atlantic areas of Europe, notably Britain & Ireland, the Basque Country & SW France and mainland Scandinavia, where the T allele peaks. I say because what we find in some Chalcolithic sites, notably in the Basque Country, rather strongly suggests that there was already a TT population somewhere and we have not yet found it. So maybe some of the premises of the positive selection theory are not as sound as I said above – but we do not know yet.


    First ever bronze was smelt in the Balcans

    It seems that West Asia is losing a bit of its relevance as the origin of nearly every development. Much as the first steel is now known to have been made in Central Africa several centuries before the Hittites (or not: see update below), the first bronze (“tin bronze” to be specific) seems now to have been made in the Balcanic peninsula, more than a thousand years before it was in Mesopotamia.
    Miljana Radivojevíc et al. Tainted ores and the rise of tin bronzes in Eurasia, c. 6500 years ago. Antiquity 87 (2013). Freely accessibleLINK

    Abstract

    The earliest tin bronze artefacts in Eurasia are generally believed to have appeared in the Near East in the early third millennium BC. Here we present tin bronze artefacts that occur far from the Near East, and in a significantly earlier period. Excavations at Plocnik, a Vinca culture site in Serbia, recovered a piece of tin bronze foil from an occupation layer dated to the mid fifth millennium BC. The discovery prompted a reassessment of 14 insufficiently contextualised early tin bronze artefacts from the Balkans. They too were found to derive from the smelting of copper-tin ores. These tin bronzes extend the record of bronze making by c. 1500 years, and challenge the conventional narrative of Eurasian metallurgical development.

    The specific well-dated finding is from Plocnik, Southern Serbia, however as we can see in the map below, most 5th millenium bronze sites are from Bulgaria.

    This highlights the likely central role in this earliest bronze metallurgy of the Karanovo-Gumelnita culture (very likely a full-fledged state older than dynastic Egypt), which spanned most of Bulgaria, as well as some nearby regions by the south and the north. However the neighbor cultures of Gradesnica-Krivodol (NW Bulgaria and nearby Romanian areas) and Vinca (Serbia) were also involved.
    The highest quality alloys (stannite bronzes) belong to this core area of Thrace (Karanovo, Smjadovo and Bereketska Mogila), as well as Southern Serbian sites (Plocnic and Lazareva) while a second category, “high tin fahlore”, seems to concentrate along the Danube (Gomolava and Ruse). A “low tin fahlore” category is rarer and seems centered in the Gradesnica area.
    For some reason, maybe the disruptive Indoeuropean invasions of the 4th millennium, this technology was apparently lost later on, only to be regained from a West Asian source (Troy) already in the 3rd millennium.
    An interesting question is the source of tin, which was in many cases the mineral stannite. The authors suggests further research on isotopes but also consider ancient mines that could have been sources:

    Stannite is present in the Bronze Age mines of Mushiston in Tajikistan (Weisgerber & Cierny 2002), Deh Hosein in Iran (Nezafati et al. 2006), the Bolkardăg mining district in Turkey (Yener & ̈Ozbal 1987), as well as in Iberia (Rovira & Montero 2003).

    The West and Central Asian mines are often argued not to have been sizable enough to be a major source of tin in the Bronze Age proper but, considering that this is a very early and limited bout of advanced metallurgy, I guess that they are also possible sources.

    Update (Jan 22): I must (partly) take back my initial comment on steel metallurgy being older in Niger than Turkey: while the discovery of Nigerien steel-making c. 1500 BCE stands, other recent findings in Turkey seem to push back steel metallurgy in Anatolia to c. 1800 BCE (instead of the c. 1300 BCE date accepted before). Thanks to Aeolius for making us aware of this important detail.

    Note: thanks to the Stone Pages newsletter ArcheoNews for directing me to this most interesting study.


    Ancient Italian ape had human-like precission grip

    Reconstruction of O. bamboli (Pavel Major / ICP)
    Oreopithecus bamboli was primate species, surely a hominine (great ape excluding orangutans) that lived in Tuscany and Sardinia some 8.2-6.7 million years ago.
    It has great interest regarding human evolution because it is the oldest known ape to have developed a pad-to-pad precision grip, a characteristic otherwise only found in the human genus.
    This trait, hotly debated in the last decades, has been recently confirmed by researchers of the Catalan Institute of Paleontology Miquel Crusafont (ICP). It must be said however that this development is considered convergent evolution and not ancestral to our own precision grip.
    O. bamboli fossil
    (CC by Ghedoghedo)
    I guess that much of the controversy is caused by the old hypothesis that argued that it was the precision grip itself which elicited human brain development, something that obviously did not happen with Oreopithecus.
    Other traits of this species are quite different from our own or our australopithecine relatives. They probably walked upright but with different gait (unlike the more human-like Sahelanthropus, of similar age) and their feet were very much unlike ours, with a very open angle for the big toe (hallux).
    It seems that their environment was swampy and not strictly forestal.
    Sources[es/cat/en]: Pileta, Diari de Girona, Wikipedia.
    Ref.: Sergio Almécija et al., The morphology of Oreopithecus bambolii pollical distal phalanx. AJPA 2014. Pay per viewLINK [doi:10.1002/ajpa.22458]
     

    Ancient European DNA and some debatable conclusions

    There is a rather interesting paper still in preparation available online and causing some debate.
    Iosif Lazaridis, Nick Patterson, Alissa Mittnik, et al., Ancient human genomes suggest three ancestral populations for present-day Europeans. BioArxiv 2013 (preprint). Freely accessibleLINK [doi:10.1101/001552]

    Abstract

    Analysis of ancient DNA can reveal historical events that are difficult to discern through study of present-day individuals. To investigate European population history around the time of the agricultural transition, we sequenced complete genomes from a ~7,500 year old early farmer from the Linearbandkeramik (LBK) culture from Stuttgart in Germany and an ~8,000 year old hunter-gatherer from the Loschbour rock shelter in Luxembourg. We also generated data from seven ~8,000 year old hunter-gatherers from Motala in Sweden. We compared these genomes and published ancient DNA to new data from 2,196 samples from 185 diverse populations to show that at least three ancestral groups contributed to present-day Europeans. The first are Ancient North Eurasians (ANE), who are more closely related to Upper Paleolithic Siberians than to any present-day population. The second are West European Hunter-Gatherers (WHG), related to the Loschbour individual, who contributed to all Europeans but not to Near Easterners. The third are Early European Farmers (EEF), related to the Stuttgart individual, who were mainly of Near Eastern origin but also harbored WHG-related ancestry. We model the deep relationships of these populations and show that about ~44% of the ancestry of EEF derived from a basal Eurasian lineage that split prior to the separation of other non-Africans.

    Haploid DNA
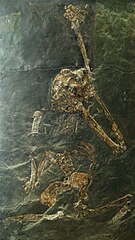
    The Lochsbour skull.
    The prominent browridge
    is very unusual for
    Paleolithic Europeans.
    The new European hunter-gatherer samples carried all Y-DNA I and mtDNA U5a and U2e.
    More specifically, the hunter-gatherer mtDNA lineages are:
    • Lochsbour (Luxembourg): U5b1a
    • Motala (Sweden):
      • Motala 1 & 3: U5b1a
      • Motala 2 & 12: U2e1
      • Motala 4 & 6: U5a2d
      • Motala 9: U5a2
    Additionally the Stuttgart Linear Pottery farmer (female) carried the mtDNA lineage T2c1d1.
    The Y-DNA lineages are:
    • Lochsbour: I2a1b*(xI2a1b1, I2a1b2, I2a1b3)
    • Motala 2: I*(xI1, I2a2,I2a1b3)
    • Motala 3: I2*(xI2a1a, I2a2, I2b)
    • Motala 6: uncertain (L55+ would make it Q1a2a but L232- forces it out of Q1)
    • Motala 9: I*(xI1)
    • Motala 12: I2a1b*(xI2a1b1, I2a1b3)
    These are with certainty the oldest Y-DNA sequences of Europe so far and the fact that all them fall within haplogroup I(xI1) supports the notion of this lineage being once common in the subcontinent, at least in some areas. Today I2 is most common in Sardinia, the NW Balcans (Croatia, Bosnia, Montenegro), North Germany and areas around Moldavia.
    I2a1b (which may well be all them) is currently found (often in large frequencies) in the Balcans and Eastern Europe with some presence also in the eastern areas of Central Europe. It’s relative I2a1a is most common in Sardinia with some presence in SW Europe, especially around the Pyrenees. I2a1 (probably I2a1a but not tested for the relevant SNPs) was also found, together with G2a, in a Chalcolithic population of the Treilles group (Languedoc) and seems to be somehow associated to Cardium Pottery Neolithic.
    If you want my opinion, I’d think that I2a before Neolithic was dominant, like mtDNA U5 (and satellites U4 and U2e), in much of Central and Eastern Europe but probably not in SW Europe, where mtDNA U5 seems not so much hyper-dominant either, being instead quite secondary to haplogroup H (at least in Western Iberia). But we’ll have to wait until geneticists manage to sequence Y-DNA in several SW European Paleolithic remains to be sure.

    Autosomal DNA and derived speculations
    Most of the study (incl. the must-read supplemental materials) deals however with the autosomal DNA of these and other hunter-gatherers, as well as of some Neolithic farmers from Central Europe and Italy (Ötzi) and their comparison with modern Europeans. 
    To begin with, they generated a PCA plot of West Eurasians (with way too many pointless Bedouins and Jews, it must be said) and projected the ancient Europeans, as well as a whole bunch of Circum-Pacific peoples on it:
    The result is a bit weird because, as you can see, the East Asians, Native Americans and Melanesians appear to fall way too close to the peoples of the Caucasus and Anatolia. This seems to be a distorting effect of the “projection” method, which forces the projected samples to align relative to a set of already defined parameters, in this case the West Eurasian (modern) PCA. 
    So the projection basically formulates the question: if East Asians, etc. must be forcibly to be defined in West Eurasian (WEA) terms, what would they be? And then answers it as follows: Caucasian/Anatolian/Iranian peoples more or less (whatever the hidden reasons, which are not too clear).
    Similarly, it is possible (but uncertain) that the ancient European and Siberian sequences show some of this kind of distortion. However I have found experimentally that the PCA’s dimension 1 (but not the dimension 2, which corresponds largely to the Asian-specific distinctions) still correlates quite well with the results of other formal tests that the authors develop in the study and is therefore a valuable tool for visualization.
    But this later. By the moment the PCA is asking and answering three or four questions by projecting ancient European and Siberian samples in the West Eurasian plot:
    • If ancient Siberians are forced to be defined in modern WEA terms, what would they be? Answer: roughly Mordvins (Afontova Gora 2) or intermediate between these and North Caucasus peoples (Mal’ta 1).
    • If ancient Scandinavian hunter-gatherers are forced in modern WEA terms, what would they be? Answer: extreme but closest (Skoglund) to Northern European peoples like Icelanders or Lithuanians.
    • If ancient Western European hunter-gatherers are forced in modern WEA terms, what would they be? Answer: extreme too but closest (La Braña 2) to SW European peoples like Basques and Southern French.
    • If ancient Neolithic/Chalcolithic farmers from around the Alps and Sweden are forced in modern WEA terms, what would they be? Answer: Canarians (next close: Sardinians, then Spaniards).
    Whatever the case, there seems to be quite a bit of autosomal diversity among ancient Western hunter-gatherers, at the very least when compared with modern peoples. This makes some good sense because Europe was a big place already in Paleolithic times and must have harbored some notable diversity. Diversity that we may well find to grasp if we only sample people from the same areas once and again.
    On the other hand, they seem to cluster in the same extreme periphery of the European cluster, opposed to the position of West Asians, and therefore suggesting that there has been some West Asian genetic flow into Europe since then (something we all assume, of course). 
    Using Lochsbour as proxy for the WHG (Western hunter-gatherer) component, Mal’ta 1 as proxy for the ANE (ancient north Eurasian) one and Stuttgart as proxy for the EEF (early European farmer) one, they produce the following graph (to which I added an important note in gray):
    The note in gray is mine: highlighting the contradictory position where the other Western hunter-gatherers may fall in because of assuming Lochsbour as valid proxy, when it is clearly very extreme. This was not tested in the study so it is inferred from the PC1, which seems to best approach the results of their formal tests in the WHG vs EEF axis, as well as those of the WHG vs Near East comparisons.
    I tried to figure out how these formal tests are reflected, if at all in the PCA, mostly because the PCA is a much easier tool for comprehension, being so visual. Eventually I found that the dimension 1 (horizontal axis) is very close to the genetic distances measured by the formal tests (excepted those for the ANE component, obviously), allowing a visualization of some of the possible problems caused by their use of Lochsbour as only reference, without any control. Let’s see it:

    The same PCA as above with a few annotations in magenta and green
    While not exactly, the slashed vertical magenta line (median in the dimension 1 between Lochsbour and Stuttgart) approximates quite well the WHG vs EEF values measured in the formal tests. Similarly, the slashed green axis (median in PC1 between Lochsbour and an good looking Bedouin) approximates to a great extent the less precise results of the formal tests the authors applied to guesstimate the West Asian and WHG ancestry of EEFs, which ranged between 60% and almost 100% West Asian (my line is much closer to the 60% value, which seems more reasonable). 
    When I tried to find an alternative median WHG/West Asian line, using Braña 2 and the first non-Euro-drifted Turk I could spot (Anatolia is much more likely to be the direct source of West Asian ancestry in Europe than Bedouins), I got exactly the same result, so no need to plot any second option (two wrongs sometimes do make one right, it seems). But when I did the same with La Braña 2 and Stuttgart I got a genuine good-looking alternative median line, which is the slash-and-dot magenta axis.
    This alternative line is probably a much more reasonable 50% WHG-EEF approximation in fact and goes right through Spain, what makes good sense for all I know.
    Of course the ideal solution would be that someone performed good formal tests, similar to those done in the study, with Braña 2 and/or Skoglund, which should be more similar to the actual WHG ancestry of modern Europeans than the extremely divergent Lochsbour sequence. An obvious problem is that La Braña produced only very poor sequences but, well, use Skoglund instead or sample some Franco-Cantabrian or Iberian other Paleolithic remains.
    Whatever the solution, I think that we do have a problem with the use of Lochsbour as only WHG proxy and that it demands some counter-testing. 
    What about the ANE component? I do not dare to give any alternative opinion because I lack tools to counter-analyze it. What seems clear is that its influence on modern Europeans seems almost uniformly weak and that it can be ignored for the biggest part. As happens with the WHG, it’s quite possible that the ANE would be enhanced if the sequence from Afontova Gora is used instead of that of Mal’ta but I can’t foresee how much. 
    Finally some speculative food-for-thought. Again using the visual tool of the PCA, I spotted some curiosities:

    Speculative annotations on the PCA

    Most notably it is apparent that the two WHG populations (Western and Scandinavian) are aligned in natural axes, which seem to act as clusters. Extending both (dotted lines) they converge at a point closest to some French, notably the only “French” that tends towards “Southern France” and Basques. So I wonder: is it possible that these two WHG cluster-lines represent derived ancient branches from an original population of SW France. We know that since the LGM, the area of Dordogne (Perigord) was like the megapolis of Paleolithic Europe, with population densities that must have been several times those of other areas. We know that this region was at the origin of both Solutrean and Magdalenian cultures and probably still played an important role in the Epipaleolithic period. 
    So I do wonder: is that “knot” a mere artifact of a mediocre representation or is it something much more real? Only with due research in the Franco-Cantabrian region we will find out.